Documentation menu
Health rules
Scope, conditions, tiers and timing, how to write a health rule that pages on the right thing, at the right severity, without flapping.
A health rule is the customer’s own definition of “unhealthy” for one kind of thing, availability of an API, forwarding loss on a path, association quality across a site. You create one from Alerts → Health rules → New health rule.
Browse and restore defaults
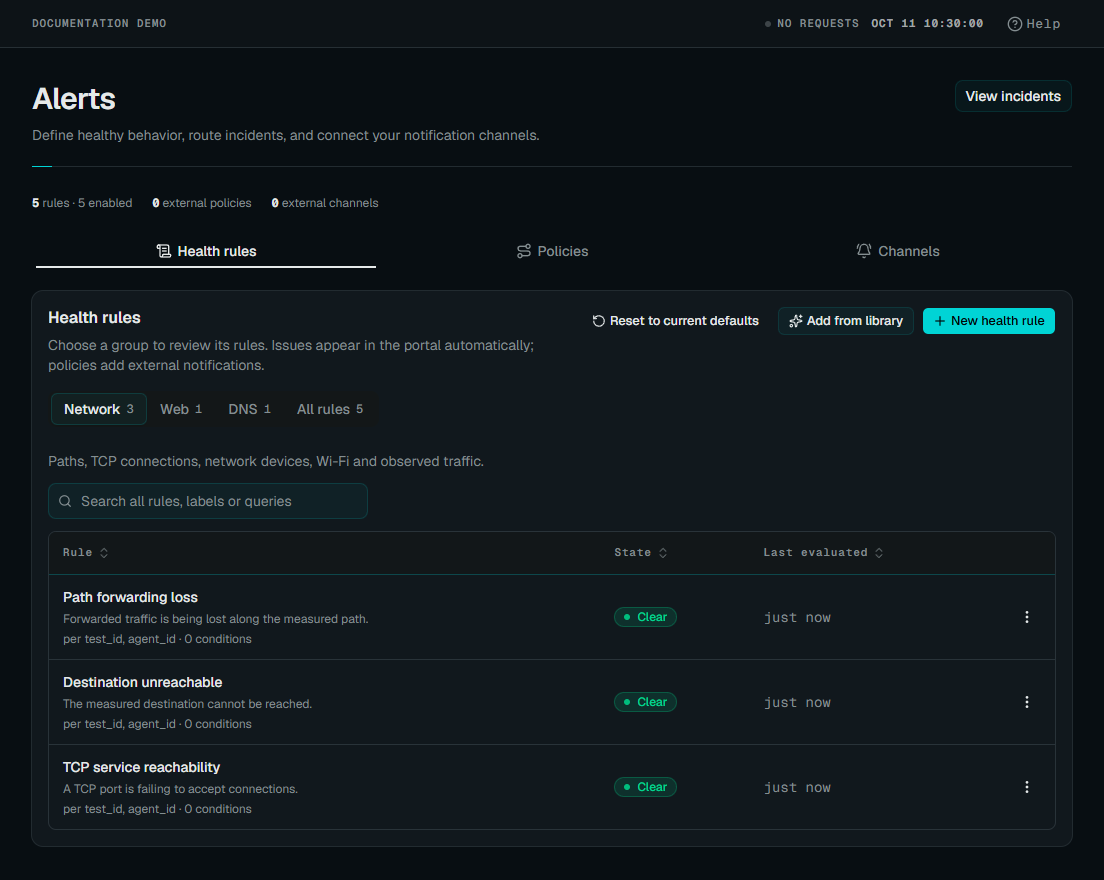
Health rules are grouped into Network, Web, DNS, Server, Agent, OpenTelemetry and Custom. Network includes paths, TCP, devices, Wi-Fi and observed traffic. Web includes HTTP and browser checks. Server covers host resources and kernel health; Agent covers the agent’s own capacity and reliability. OpenTelemetry covers imported HTTP and database metrics, host memory and filesystem capacity. Use All rules to see everything. Search covers all groups, including rule names, labels and queries. Open a rule for its full conditions, timing and routing details.
 Enlarge screenshot
Installed library rules keep your saved settings when RouteSpear’s defaults change. An Update available badge identifies older template versions. Choose Reset to current defaults to preview installed library rules; older versions are selected initially. Expand a rule to review its replacement conditions, then confirm the selected customizations can be replaced.
Reset restores the template’s name, description, scope, conditions, thresholds, timing and trust settings. It preserves IDs, incident history, labels, runbooks, ownership, pause, enabled state and active/shadow mode. Policies and channels stay saved, though a new scope can change which policies match. The selection is saved together; if a rule changed after the preview, reload and review it again. Custom rules and deleted defaults are untouched. Use Add from library to restore a missing rule.
OpenTelemetry defaults
The OpenTelemetry library includes HTTP server and client p95 latency, HTTP server 5xx counts, database operation p95 latency, database pool timeouts, host memory pressure and filesystem capacity. Templates use exact instrument names, kinds and units; a recent OTel metric of a different name does not make them applicable. Preview the rule and adapt legacy SDK names or attributes before using it. New library additions do not replace or automatically join an existing account’s saved rules. Installation defaults to shadow mode.
Service rules group by service.namespace, service.name and
deployment.environment.name. Host rules require host.id and keep ingestion
sources separate; filesystem rules also require and group by mountpoint.
Latency thresholds are in seconds, utilization thresholds are fractions, and
HTTP errors are counts of observed 5xx requests, not percentages. Histogram
counts count requests, while minimum samples count usable exported datapoints.
All seven use ten-minute windows, three datapoints and five-minute breach/clear holds. Missing data stays indeterminate. An explicitly reported zero can clear an error/count rule; an absent error stream cannot. Collector pauses and new cumulative baselines must not be treated as healthy zeroes.
Target
Scope by decides what one entity is, the thing the rule judges
separately. Leave it as whole tenant for a rule with one answer across
everything, or pick up to four dimensions: target, test_id, agent_id,
site_id, device_id, test_type, or another dimension from more….
Scoped by target, a rule judges every target separately and can open a
separate incident for each; scoped by site_id, one incident per site.
A dimension marked with * is high-cardinality (target, test_id,
subject_address, subject_hostname, subject_if_name, device_id,
device_name, interface_id) and needs a narrowing matcher (a metric name
or an equality/in filter) somewhere in the rule, or in the selector below.
Scoping a tenant-wide rule by raw target with nothing narrowing it would ask
the evaluator to track every target you have ever measured; the editor
refuses to save until something narrows it.
Only entities matching is an optional MetricQL selector ({...} matchers
only, no metric name and no | stage) merged into every condition,
{site_id in ("bos", "nyc"), test_type="http_check"} limits the rule to two
sites’ HTTP checks without repeating that filter in each condition.
Conditions
New conditions start in Metric builder. Choose or type a metric, choose how to measure it over the window (average, minimum, maximum, sum, sample count, or percentile), and add optional field/operator/value filters. All filters must match. By default, new conditions evaluate separately for the rule’s scope; choose One value across all matching entities to broadcast a single value instead. Then set the severity thresholds below.
Choose Metric query (advanced) under Define condition with for arithmetic, counter rates, set filters, source pipelines, joins, and calculated outputs. Switching to query mode keeps the builder’s expression. Simple saved conditions, including the library’s metric rules, open in the builder; complex queries stay in query mode and cannot be converted unless the query can be represented without losing any of its meaning.
A condition is one query yielding a numeric
value per scoped entity, plus one to three severity tiers. It can be a metric
selector, an arithmetic expression, or a source pipeline ending in pick:
hop_health_forwarding_loss_max{test_type="path_health"} | max by (test_id)with tiers such as warning when value > 0.02 and critical when value
> 0.05. A tier’s operator is one of > >= < <= == !=; the tiers in one
condition share the same operator, and their values must move consistently in
the severity direction, a warning tier looser than its critical tier, not
the other way round.
A condition’s by (...) (if it has one) must match the rule’s scope, or have
none at all, a condition with no grouping is one value applied to every
entity the rule judges, the same broadcast rule the query language itself
uses for arithmetic. A rule holds at most eight conditions.
Prefer stable test_id and agent_id dimensions for health identity. Grouping
only by names can combine distinct entities, and a rename changes that scope’s
identity. You can still filter by test.name or agent.name; those predicates
use current metadata. test_id identifies an individual check definition;
test.group_id identifies its containing test group.
Advanced, per condition:
- Minimum samples in window: fewer than this and the condition is
indeterminate rather than breaching on a thin sample.
0disables the floor. - Minimum trusted agents: corroboration:
2means one agent alone cannot breach the condition by itself.0defaults to one for native or mixed queries and none for imported-only OpenTelemetry metrics, spans or logs. A positive requirement always applies; imported resources are not agents.
Source queries in conditions
The condition editor has the same IntelliSense as Metrics Explorer, including
source fields and units, filters, joins, calculated outputs, and baseline
profiles. Agent and test suggestions show names with IDs and insert the ID or
name appropriate to the filter. Press Ctrl+Space for suggestions. Use Enter to accept and Escape
to dismiss. A rule-wide selector still accepts only {...} matchers.
Source queries must end with pick to select one numeric output, even when
summarize contains only one measurement. Use from tests with full metric
names across all check types and storage sources:
from tests
| where test_type = "http_check"
| summarize avg(http_check_passed) as pass_rate by test_id, agent_id
| pick pass_rate
Scope this rule by test_id, agent_id to judge each check from each vantage
separately. A threshold of < 0.8 means fewer than 80% of observed checks passed
their configured expectations. Missing samples are not failed checks.
Specific sources also offer short local field names:
from host_resources
| where resource_kind = "service" and process_name = "postgres"
| summarize avg(cpu_percent) as cpu, max(rss_bytes) as memory
  by agent_id
| pick cpu
Scope this rule by agent_id. For example, configure warning at > 80 and
critical at > 150 for CPU measured relative to one core; values above 100 are
possible across multiple workers or cores. Use cpu_host_percent instead if
you want percent of the entire host’s logical CPU capacity. To evaluate memory,
add another condition ending in pick memory, with thresholds in bytes.
For calculated outputs, join and extend before the final pick. The formula
uses each input’s aggregate over the evaluation window; it is not an average
of ratios from chart buckets. Put source-specific filters inside each source
query because the rule-wide selector is merged into every input.
Picked source conditions reject order by and limit. Avoid top-N selector
conditions for fleet health too: dropping out of a ranked result is not evidence
of recovery.
Use Query language
for a complete process-to-host ratio example.
Source pipelines support fixed thresholds and learned-baseline conditions.
For a baseline, pick must select a measured output aggregated with avg, min,
max, or a percentile, without joins or calculations. Current-metadata
relationships, totals, sample counts, counter conversions, reductions, and
rankings cannot define a learned baseline: their evaluated outputs need separate
history. Use stable IDs and recorded labels for baseline filters and scope.
See Advanced health-rule recipes for suggested
test/agent, service-absence, and probe-budget rules with timing and no-data settings.
Baseline-based latency rules
Choose Against the baseline under Thresholds. This works with a metric
selector or a source query ending in pick:
from tests
| summarize avg(http_check_total_ms) as latency by test_id, agent_id
| pick latency
Set Scope by to test_id, agent_id. Choose a seasonal profile, a method,
and the direction of change. A baseline tier describes distance from learned
history, rather than an absolute threshold. For example, Robust sigma with
warning at 3 and critical at 5 judges how unusual a sustained increase is.
Absolute delta with warning at 100 and critical at 300 means that many
milliseconds above the historical median for this query.
The library’s HTTP response time regression, DNS response time regression, and TCP connect-time regression combine both methods using All conditions:
- Each compares the ten-minute mean with its own test/agent
daily_28dhistory. - Warning requires more than 3 robust sigmas above the seasonal median; critical requires more than 5.
- HTTP also requires more than 100 ms above that median for warning or 300 ms for critical. DNS and TCP require more than 20 ms or 100 ms respectively.
- Five samples, five sustained minutes of breach, and measuring-agent fidelity are required; resolution takes five clear minutes. No data uses Hold.
Requiring a meaningful absolute increase prevents tiny deviations on a flat baseline from paging. All conditions must reach critical for the combined rule to be critical. Baselines learn the distribution of the selected measurement’s samples; the current window aggregate is compared with that distribution. They do not learn a distribution of chart-bucket averages or calculated ratios.
The built-in daily_28d profile needs at least 200 historical samples across
3 distinct days before judging, and history for the current seasonal slot.
While learning or missing a slot, the condition is indeterminate, not clear.
The library’s optional HTTP response time limit supplies a fixed ceiling
when an absolute service objective must also hold during learning. Reachability,
pass/fail, certificate expiry, and capacity limits remain fixed-threshold rules:
an ongoing failure must not become acceptable just because it is usual.
Specific source fields also work, such as
from host_resources | where resource_kind = "service" | summarize avg(cpu_percent) as cpu by agent_id | pick cpu.
Source identity and filters are retained when history is learned. The final
pick chooses the measured output; do not append a baseline(...) query stage
as well as selecting baseline judging in the condition editor.
Service absence and collection coverage
Configure exact Processes to monitor names in the host check before using absence queries. A process missing from a top-process snapshot may simply have fallen out of the snapshot’s ranking.
host_service_instances{process_name="postgres"} | max by (agent_id)With an == 0 tier, this means the monitored name was absent throughout the
reporting samples in the evaluation window. A zero count is emitted only for
a complete collection. To make any incomplete reporting sample suppress the
condition’s numeric result, divide by minimum coverage:
host_service_instances{process_name="postgres"} | max by (agent_id)
/ host_service_coverage{process_name="postgres"} | min by (agent_id)
Zero coverage makes the result absent, allowing the rule’s indeterminate
no-data behavior to apply. Coverage describes samples that arrived; it does
not prove that a collector is still reporting. Inspect
host_service_sample_age_seconds{process_name="postgres"} | min by (agent_id)
for the freshest sample age and configure no-data handling for a stopped
collector. Missing data should not be interpreted as a healthy zero.
Combining conditions
With more than one condition, An entity is unhealthy when picks how they combine into one outcome:
| Choice | Meaning |
|---|---|
| All conditions | Every condition must breach; the weakest severity wins |
| Any condition | One breached condition is enough; the highest severity wins |
| N of M | At least the chosen number must breach; severity is the loudest among just enough of them |
A single-condition rule with All conditions and one condition behaves exactly like the classic single-metric alert, that combinator is the default, so a first rule needs no thought about it.
Timing
Hysteresis keeps one flapping entity from becoming twenty pages: fire only after a breach has held, clear only after it has stayed clear.
- Evaluate every: how often the rule ticks. 60 s by default, 30 s minimum.
- Over a window of: how much history every condition aggregates each tick. 5 minutes by default, from 30 seconds to 24 hours.
- Fire after breaching for: how long a breach must hold before an
incident opens. 2 minutes by default;
0opens on the first breaching tick. - Resolve after clear for: how long a clear must hold before the
incident resolves. 5 minutes by default;
0resolves on the first clear tick. - When a condition has no data: what an entity with no rows at all does after a few ticks of silence: Hold (indeterminate; the default), Treat as OK, or Treat as breach at the rule’s own severity. A handful of consecutive absent ticks are ignored outright, on the assumption that a late-arriving writer is more likely than an entity actually gone.
Trust
What makes a RouteSpear alert different: it will not page you on a measurement the agent itself could not vouch for.
Require measuring-agent fidelity (on by default) excludes contributions from physical workers whose latest eligible health at or before evaluation is degraded or stale. This grades workers contributing to the evaluation window; it is not a historical health lookup for each individual sample. If every contributing agent was excluded, the tick is indeterminate rather than a breach, and the incident records which agents were dropped and why. See the trust model.
Leave fidelity gating off for rules that evaluate agent health itself, such as probe-budget saturation; otherwise the degraded agent can suppress the signal the rule is meant to detect.
There is also a Settle after a path or vantage change toggle, intended to hold judgement for one window after a route or vantage change so a re-route becomes a note on the incident rather than the incident itself. The setting is saved with the rule but the evaluator does not act on it yet, see what alerts do not do yet.
About and lifecycle
Name, Description (sent with every notification, say why this matters and who cares), Runbook URL (linked from every incident and notification that has one), and Labels, key/value pairs carried onto every incident the rule opens, which a policy can match on.
Enabled turns evaluation off without deleting the rule; disabling resolves any open incidents. Mode is Active or Shadow, a shadow rule evaluates, opens incidents, and writes health history exactly like an active one, but never notifies a channel. Write a rule in shadow, watch it for a few days, then switch it to active once the tiers look right.
Preview
Preview runs the rule as written, right now, against live data, without saving it, useful for checking a new condition’s tiers before committing to them. It shows the same per-entity breakdown described in Incidents: health state, dims, trusted and excluded agents, and each condition’s chip. Nothing from a preview is stored.
Health right now
An existing rule’s editor shows Health right now: every entity’s current
state, the scope values that identify it, its weakest condition, and a 0–100
health score, linking straight to any open incident. This is the same query
result a dashboard’s active_alerts panel or a floor plan could colour by,
without opening a single incident, health is recorded on every tick whether
or not anything is firing.
Routed by lists which policies currently match this rule, with a link to manage them.
Deleting a rule
Deleting a rule with open incidents is refused once, with a prompt to confirm
– the confirmation resolves them first (rule_deleted) so nothing is left
firing with no rule behind it.
Next
- Channels: where a notification can go
- Policies: routing this rule to a channel
- Incidents: what a breach looks like once it opens
- Query language: the full grammar a condition accepts