Documentation menu
Metrics Explorer
Query any metric directly by name, label or platform dimension, without picking a test first or building a panel around it.
A dashboard panel answers a question you already know you will ask again. Most questions during an investigation are not that; they are “does anything else look like this”, asked once, about whatever the data will admit. Metrics Explorer is for that second kind.
Panels vs. the Explorer
| Dashboard panel | Metrics Explorer | |
|---|---|---|
| Scope | One test, or an explicit set of tests/agents | Every record across your tenant that matches |
| You choose | A test or agent first, then a metric | A query; scope falls out of the filters you write |
| Where it lives | Saved, arranged on a dashboard | A scratchpad, with queries you can save by name |
| Best for | The view a team looks at every day | “Is anything acting weird right now”, root-causing an alert |
Reach for the Explorer when you do not yet know which test, agent or label is involved, that is exactly the thing it is built to find. Once you know, and you will want to look again, either save the query, or build a panel on it, a dashboard panel’s Query language source runs the same query text, typed or saved. See Dashboards and Panels and metrics.
The query bar
Type a query and press Run (or Ctrl+Enter; Cmd+Enter on macOS). Start
with a metric selector or a from source pipeline. A selector names a metric,
filters dimensions, and optionally aggregates or combines values with + - * /:
http_check_total_ms{target=~"api-.*"} | avg by (agent_id)Ctrl+Space opens IntelliSense on demand. Suggestions also appear as you type:
metric names, sources, fields with units, filter operators and values,
aggregations, grouping dimensions, joins, calculation aliases, ranking, and
baseline profiles/statistics. Use arrow keys and Enter to accept, or Escape
to dismiss. Suggestions continue into arguments after you choose a stage.
The same completion engine is available in dashboard query series and alert
conditions. Agent and test suggestions show names alongside IDs: selecting
one in an ID filter inserts its ID, while a name filter receives its quoted
name. Suggestions use current tenant metadata, so they can include entities
without observations in the selected time range.
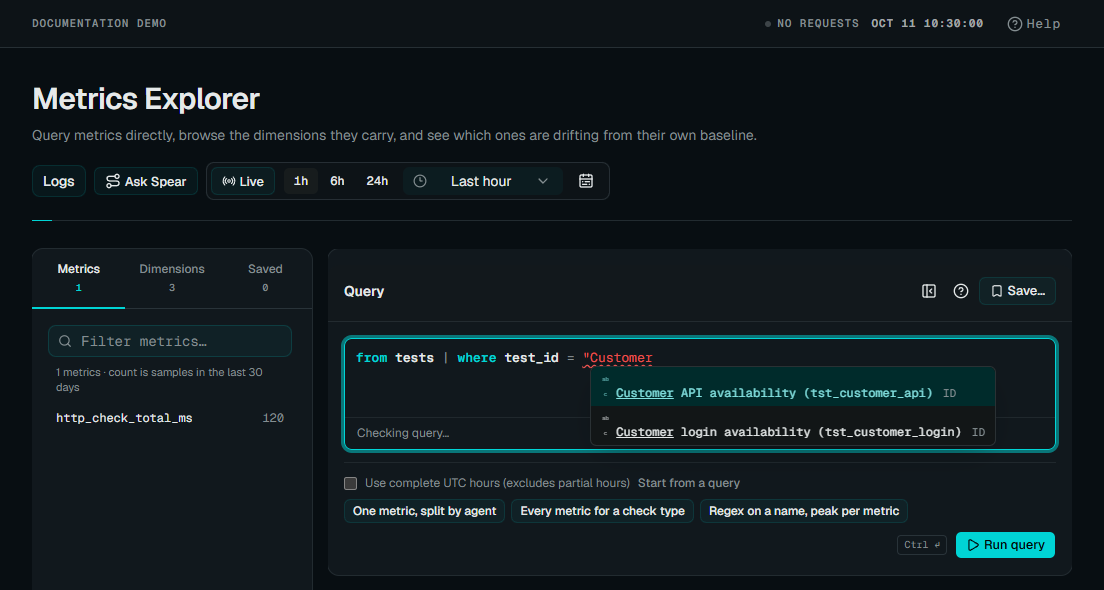 Enlarge screenshot
test_id filter inserts the ID.Use from tests for full metric names across all check types and storage sources:
from tests
| where test_type = "http_check" and test.name =~ "API.*"
| summarize p95(http_check_total_ms) as latency by test_id, test.name, agent_id, agent.name
| order by agent.name asc
Keep IDs alongside names to separate entities with duplicate names. The names
are current metadata, including on historical results. Use test.group_id to
select the group containing several checks.
To compare several measurements together, start with a source pipeline:
from host_resources
| where resource_kind = "process" and monitored = true
| summarize avg(cpu_percent) as cpu, max(rss_bytes) as memory
  by agent_id, process_name
| order by memory desc
| limit 20
This selects the top 20 entities by memory in each bucket and keeps their CPU
and memory outputs together. Each output retains its own unit. To turn an
unranked source query into an alert condition, finish with | pick cpu or
another output alias. Follow the detailed walkthroughs and syntax reference in
Query language.
A few examples, chosen from the metric catalog, are one click away under the query bar. Catalog membership does not guarantee observations in the selected range. With no catalog data you will instead see the general form of each:
- One metric, split by agent:
http_check_total_ms | avg by (agent_id) - Every metric for a check type:
{test_type="http_check"} | avg by (metric_name) - A regex on a name, peak per metric:
{metric_name=~"http_check_.*"} | max by (metric_name)
Saving queries
Save next to Run keeps the query in the editor by name, with an optional description. A saved query is private unless you switch on Share with the organization, in which case everyone in your tenant can run it from their own Explorer and build panels on it. Only the person who saved a query can edit or delete it, shared or not.
Saved queries appear in the Saved queries card on the left, yours and those shared with you, in one list. Click one to load and run it. Own queries carry a visibility toggle (the globe or lock) and a delete control. While a saved query is loaded the editor says so under the query bar; edit the text and Save offers to update that query in place or to save the edited text as a new one. Save as new from a query somebody shared with you is how you take your own copy.
What is stored is the query text, exactly as written. It is parsed again every time it runs, so a saved query keeps working across changes to your promoted dimensions, a label that was unindexed when the query was saved simply starts reading the indexed column once it is promoted.
Deleting a shared query affects anyone who built a panel on it: that panel reports the query as missing until it is pointed elsewhere. The delete confirmation says so.
The dimension browser
The panel on the left is how you find what to query without already knowing the vocabulary.
Metrics lists registered metrics and discovered custom metrics, with recent sample counts where available. Registered metrics remain discoverable with no observations. Click one to drop it into the query as the metric name.
Dimensions groups every filterable key into four sections, covered in full
in Dimensions: Identity (which test, which
agent, what target), Platform (context the system stamps on every record,
such as transport or network scope), Entity (facts resolved after the fact,
such as the device a target turned out to be), and Your labels (label keys
a check or script attached to the record, plus configured agent and test labels).
Promoted labels are included; other label discovery is bounded rather than
exhaustive. Expand a dimension to see a sample of its recent
values; clicking one appends key="value" to the query’s selector.
Reading the results
Rolling time presets keep exact times while detailed measurements are retained. For older periods, Explorer automatically excludes partial minutes or hours when needed for the chart and its comparison. A notice shows the actual start and end times used. Custom ranges keep their exact boundaries unless you enable Use complete UTC hours.
If the selected period is available but its preceding comparison period has expired, the chart and current average still appear. Explorer explains why the baseline is unavailable and leaves the deviation unscored. Queries that require expired raw samples still need a more recent range or supported summary fields.
Each row is one series: its dimension values as chips, a sparkline, its current average, and a deviation badge.
Deviation compares the current window’s mean against the mean and standard
deviation of the immediately preceding window of equal length, the same
span, shifted back. For a plain metric selector, the comparison uses
sample-weighted averages and standard deviations, independently of the chart’s
sample aggregation. For source selections, arithmetic, counter conversions,
reductions, and ranked selectors, it summarizes evaluated chart buckets instead,
using a common bucket width for both windows. A ratio’s comparison therefore
describes its calculated output. This preceding-window comparison is separate
from a learned baseline(...) profile.
| Badge | Meaning |
|---|---|
no baseline |
The preceding window had no data, or its required detail is no longer retained; a notice explains retention limitations |
z … · quiet |
Within about two standard deviations of the baseline |
z … · notable |
Two to four standard deviations out |
z … · severe |
Four or more standard deviations out |
Selector results initially sort by deviation, largest first. Source queries
preserve their query ordering, including order by agent.name or an output
alias. You can also sort with the result table’s column headers.
Drilling in
Click a row to open it full size, with the test or agent it came from linked directly, and up to eight related metrics from the same test plotted alongside it, the fastest way to see whether this metric moved alone or something upstream of it did.
Time range and limits
The time range control at the top applies the same way it does on a dashboard; see Time range and live mode.
A query may return at most 200 series. Grouping by a high-cardinality
dimension with no filter (by (target) across a whole tenant, say) can
otherwise ask for thousands of series that are too many to read and expensive
to score; past the limit the Explorer asks you to add a filter or narrow the
by (...) clause rather than silently truncating the results in a way that
could hide the one series you came for.
The Explorer uses raw samples or eligible retained summaries according to the requested time range, dimensions, and aggregation. Queries requiring detail absent from a summary still need raw retention; a rollup cannot reconstruct that detail. Source outputs share a common bucket width when one needs coarser retained data. Narrow the range or filters when a query needs too many series or raw samples that are no longer retained.
Next
- Query language: the full syntax, with worked examples
- Dimensions: every key you can filter or group by
- Dashboards
- Alerts: once a query is worth watching continuously rather than checking by hand