Documentation menu
Log ingest rules and incident evidence
Configure local or SSH log sources, choose unhealthy-agent and test triggers, and attach redacted excerpts to incidents.
Log ingest rules are organization-wide configuration under Configure. Choose where to collect logs and which unhealthy agents or tests should trigger collection. RouteSpear attaches bounded, redacted excerpts to the triggering incident, so application evidence stays with the investigation.
For the approach and data-volume tradeoffs, see Logs, only when it matters.
Search logs without an incident
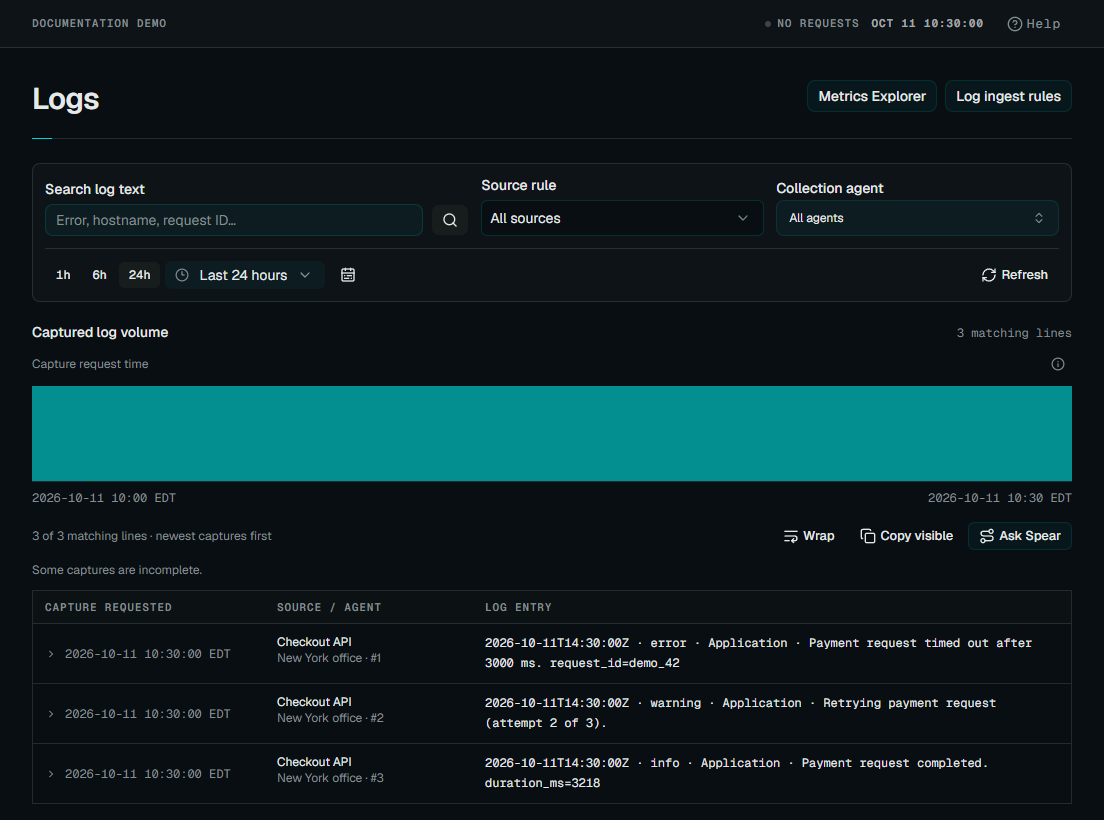
Open Analyze → Logs, or use Logs in Metrics Explorer. Search retained excerpts by literal, case-insensitive text and filter by source rule, collection agent, and capture request time. The time filter applies to when collection was requested, rather than timestamps within each excerpt. Captures are retained for 14 days. The captured-volume timeline lets you narrow the request-time window. Expand a log entry to inspect its raw text, source, original line number and collection limits. Use Copy visible or Ask Spear to work with the visible evidence; incomplete captures remain labeled.
 Enlarge screenshot
To collect evidence without an incident, expand Collect logs now, choose an enabled conditional ingestion rule and one of its collection agents, then select Collect logs. The saved source, match patterns, redaction, and capture limits apply. Timestamped captures use the rule’s before-plus-after duration ending at request time; tail captures read the latest configured number of lines when the agent executes the request. A capture can be incomplete when local history is unavailable. Requests expire after 15 minutes and each source has a 60-second manual collection cooldown; the agent’s shared command queue remains bounded.
Viewing and collecting application logs requires agent:manage. Listing rules also requires agent:read, and incident captures additionally require incident:read. Searching cannot recover log lines that were never uploaded; an empty result is not proof of application health.
Set up an ingest rule
Open Configure → Log ingest rules and select Add ingest rule. Choose the collection agent, then a local source or Remote host over SSH. Existing rules appear here automatically. The agent’s Logs tab is for agent diagnostics and links to this configuration.
Logs on the agent host
- File / redirected stdout or stderr: enter an absolute path such as
/var/log/myapp/app.logorD:\ApplicationLogs\app.log. Windows accepts forward slashes, backslashes, and UNC file paths. The agent service account needs read access, and the host operator must set-log-rootto an approved directory in the agent’s local service configuration. Both absolute and relative paths must stay inside that directory; symlinks cannot escape it. File collection is disabled without-log-root.-log-filecontrols the agent’s own diagnostics. - Windows Event Log: choose Application or System on a Windows agent. Collect warning, error, and critical events (default), error and critical, or all levels. The service account needs permission to read the channel. This event filter is separate from the incident capture threshold. Event logs do not require a file collection root.
For process output, configure your application or service manager to redirect stdout/stderr to a regular file, then select it as a file source. Separate streams can use separate sources. Beacons can count untimestamped output; incident evidence can use timestamps or the last N lines. Direct attachment to running process output, systemd journal, and container APIs are not supported.
Logs on a remote SSH host
Choose Remote host over SSH, then:
- Enter the Hostname or IP and SSH port (22 by default).
- Select Authentication before filling in its parameters.
- Enter the SSH user and the matching secret reference:
- Password: Password secret reference identifies a stored SSH password.
- Private key: Private key secret reference identifies a stored, unencrypted PEM private key.
- Enter the server’s Host key SHA256 fingerprint. This verifies the remote server’s identity and is required for both authentication methods.
- Enter the rule name and an absolute POSIX File path, such as
/var/log/checkout/app.log.
The reference must be available to the collection agent through its configured secret providers and grants. Enter the reference, not the password or key itself. Changing authentication methods clears the previous reference. See Secrets for shared secret setup.
The remote host needs a POSIX shell and tail, and the SSH user needs permission
to read the file. The collector must run an updated agent with SSH log capture
support. SSH rules collect incident evidence only; Log Beacon and custom metric
extraction are available for local sources.
Choose what triggers collection
Select the tests and agents whose unhealthy incidents trigger collection.
These triggers are independent of the collection agent: a checkout test or
agent can trigger evidence collection from another agent or an SSH host.
For example, a checkout HTTP test can trigger a separate collector to retrieve
/var/log/checkout/app.log from an application server over SSH.
Incidents targeting a test group also match rules associated with its member checks.
Set a severity threshold and capture limits. The default is critical incidents,
120 seconds before, 30 seconds after, up to 200 lines and 32 KiB. Optionally
include a regular expression, surrounding context, and redaction patterns.
Patterns use Go regular expression syntax. Each redaction match becomes
[REDACTED] before upload, including matches in adjacent context.
Read the evidence
Open Incidents → incident → Log evidence. Returned excerpts attach to that incident even when another agent collects them. Each capture shows its rule name, status, time window, and available log text. Capture starts when an incident opens at the configured severity or escalates to it. Notification quiet hours and delivery failures do not prevent collection. Shadow rules do not capture.
You may see waiting, collecting, captured, skipped, failed, or unavailable evidence. Collection may fail because the agent is offline, a relative path has no configured root, or the file or event channel is unreadable. SSH captures can also fail because a credential is unavailable, authentication fails, or the server’s host key does not match. A request expires after 15 minutes. A source is captured once per incident, with a 60-second cooldown between incidents. A full agent command queue records a skipped capture.
Viewing evidence requires both incident-read and agent-management permissions. Captured bodies are retained for 14 days. The alert evaluator removes expired bodies in bounded batches; incident metadata remains. Removing a source does not erase previous evidence or change already queued policy snapshots.
What this version captures
For local sources, updated agents share a reader for each configured file. Each buffer
holds at most 256 KiB, 5,000 lines, or 10 minutes of recent text. Without an
active reader, capture searches at most the last 4 MiB of the current file. Lines
can use the timestamp formats below, or last-lines capture. In timestamped mode,
the parser reads line prefixes, JSON time, timestamp, or ts fields, or
bracketed Apache access-log timestamps. Continuation lines inherit the preceding timestamp;
leading lines without one are excluded and counted. Source clock accuracy
affects the window selection.
SSH collection waits until the incident capture window closes, then scans at most the last 4 MiB of the current remote file. It uses the same timestamp, window, context, and redaction rules. It does not maintain a remote rolling buffer or search rotated files; lines already rotated away may be unavailable.
Windows events use their native timestamps and become one JSON record each,
with level, provider, event_id, record_id, channel, structured XML
data, and message when available. All levels use lowercase names, such as
warning and error. Beacons and numeric rules match the same records; use
Beacon pattern .* to count every event selected by the source filter.
Readers start at the current channel head and collect up to 256 new matching
events / 64 KiB each second. Overflow, read errors, and detected channel resets
interrupt Beacon readiness. Restart begins a new warm-up. Without an active
reader, capture queries the newest matching events in the requested window,
up to 5,000 events / 4 MiB. Cleared or overwritten history is unavailable.
Captures stop at 500 lines or 32 KiB, whichever configured limit is reached first. Context can include up to 20 lines on either side of a match, within the incident window. Overlapping context is merged.
Readers retain buffered lines across rename rotation. Startup, restart, rotation, truncation, and buffer limits can leave incomplete history. Custom timestamp layouts are supported as described below. The incident reports collection limits and skipped untimestamped lines. An empty excerpt does not establish that the application was healthy.
Choose a rule purpose
Each rule configures one purpose: Conditional ingestion, Log Beacon, Extract custom metrics, or Always On. Use separate rules to process the same source in multiple ways. Only conditional ingestion supports remote SSH sources.
For conditional ingestion, filter tests by group, name, type, or ID. Select all selects the displayed tests; with a filter, Select all filtered adds those matches while keeping previous selections. Clear selection removes all test selections. A rule supports up to 100 tests.
Use Add pattern to configure multiple include patterns. A line matching any pattern is included, together with its configured adjacent lines. Without include patterns, collection uses the bounded incident window. Patterns use Go regular expression syntax and share a 1,024-byte limit including separators.
Apply one rule to multiple agents
Use Apply to agents to select up to 100 agents. Configure the local file path or Windows event channel once; each selected agent uses the same settings. You can change the selected agents later by editing the rule. Remote SSH rules use one collection agent.
For conditional ingestion, choose Reporting agent only (the default) to capture logs solely from the selected agent that reported the unhealthy result. Choose All selected agents to capture from every agent covered by the rule when one of them reports an unhealthy result. For example, if a host-metrics test runs on A, B, and C but the rule covers A and B, an alert from C triggers no capture. An alert from A captures A only, or both A and B, depending on the chosen scope.
Choose Specific Agent to fetch logs from one collection agent independently of the reporting agent. Select the collector, then choose tests or Trigger agents. Selected tests can trigger capture when any agent in your organization reports an unhealthy result; trigger agents collect on their health alerts. For example, an unhealthy test on A can fetch application logs from B.
Health rules must retain agent_id in their grouping. Alerts aggregated across
agents without a reporting agent do not trigger these scoped captures. Select
specific tests, or enable Any health alert from selected agents to capture
for every unhealthy series reported by a selected agent.
Each agent has its own capture limits and cooldown. Incident evidence shows which agent collected each excerpt.
Collect continuously with Always On
Select Always On after Extract custom metrics, choose a local source and collection agents, and optionally add include patterns and redaction patterns. File, syslog file, syslog receiver, and Windows Event Log sources are supported. With no include patterns, all new entries are eligible within the batch limits.
The agent follows new entries while the rule is enabled. Signed command polls request a batch about once a minute, using agent receipt time so untimestamped lines are supported. Batches cover successive, non-overlapping windows. Each batch is limited to the configured line and byte limits (at most 500 lines and 32 KiB); redaction happens on the agent before upload. No alert is required.
Always On starts with newly observed entries, not existing file contents. The local buffer holds at most 256 KiB, 5,000 lines, or 10 minutes. Startup, restarts, rotation, disconnections, failed commands, and collection limits can leave gaps; this is bounded collection, not a durable full-log archive. Batches share the existing 14-day capture retention. Pausing or deleting the rule stops new batches and removes the reader on the next configuration reload. Already dispatched batches can finish. Deploy the updated agent and control plane together to use Always On; apply the database migration for Specific Agent alert routing.
Watch for known problems with Log Beacon
For a local source, select Log Beacon as the rule type in the ingest rule editor. Add one or more problem patterns (a line may match any pattern), an optional ignore pattern, occurrence threshold, and rolling window. Matching happens locally; the agent reports a small numeric signal every 15 seconds. A full window must pass before the Beacon is ready. Missing files, lag, or dropped lines withhold the signal rather than reporting a clean window.
Save the source, then use its displayed query to create a health rule with a threshold greater than zero and missing data treated as indeterminate. Health rules determine severity; notification policies determine delivery. Beacon rules report signals without automatically uploading incident excerpts. Create a separate Conditional ingestion rule if you also need log evidence.
Beacon windows use when lines were observed locally; conditional ingestion windows use application timestamps. Existing combined rules retain their old behavior until edited; choose one purpose when saving them.
Extract numbers without uploading log lines
For a local source, select Extract custom metrics as the rule type in the ingest rule editor. Add up to eight rules to
count matching lines, sum a numeric field, or report its latest value. Read
a top-level JSON field, or specify a regular expression with a named capture
such as duration=(?P<ms>[0-9.]+) and field ms.
Choose a name and unit. A metric named checkout_duration appears as
log_custom_checkout_duration, scoped to the source’s tst_log_<source_id>
check. Each report covers the interval since the previous successful report,
normally 15 seconds. Counts and sums are window values, not cumulative counters.
An empty window produces no latest value. Invalid or missing numeric fields
withhold that metric for the window and increase the parse-failure count.
Reader readiness, lag, dropped lines, parse failures, and reporting-window seconds are available as separate metrics. Raw text stays in the bounded local buffer, and log fields cannot become arbitrary metric labels. Restart loses the raw buffer and begins another warm-up period.
Timestamped windows or the last N lines
Choose Timestamped incident window to collect within the configured seconds before and after the incident. Auto-detect known formats recognizes:
- ISO 8601 / RFC 3339, with optional fractional seconds and an offset.
- Year-first date and time, such as
2026-09-11 14:30:00.123. - Apache timestamps, such as
[11/Sep/2026:14:30:00 +0000]. - Unix seconds or milliseconds, including numeric JSON timestamp fields.
Detection happens per record and reports the formats found in the evidence notes.
Choose a specific format to constrain parsing. For other formats, select Custom
Go timestamp layout and describe the timestamp with Go’s reference date, such
as 2006/01/02 15:04:05.000. Include the year, month, day, and time. Use numeric
offsets rather than ambiguous timezone abbreviations.
Timestamps without offsets default to UTC. Set Timezone when no offset is
present to an IANA timezone such as America/New_York if needed. A timestamp’s
numeric offset takes precedence. Unmatched leading lines are excluded; subsequent
continuation lines inherit their preceding timestamp. There is no automatic
fallback to a different capture method.
Choose Last N lines for untimestamped logs. This reads the last 1–500 physical lines from the current file when the agent collects it, before applying include patterns and redaction. It does not wait for an incident time window or guarantee that the selected lines belong to the incident. The existing byte cap and 4 MiB file scan limit still apply. Windows events use native timestamps instead.
Update collection agents to use these capture and timestamp options.