Documentation menu
Reading results
The path view, the timeline, individual records, and saving a layout you want back.
Opening a test shows its Results tab: a set of panels chosen to suit the check types the test contains. A Path Health test opens on the path view; an HTTP test opens on phase timing and status.
For groups with a test policy, the current execution eligibility is shown separately from measurement health. A schedule or condition can pause collection without indicating success or packet loss; check the measurement timestamps when reading earlier results.
The path view
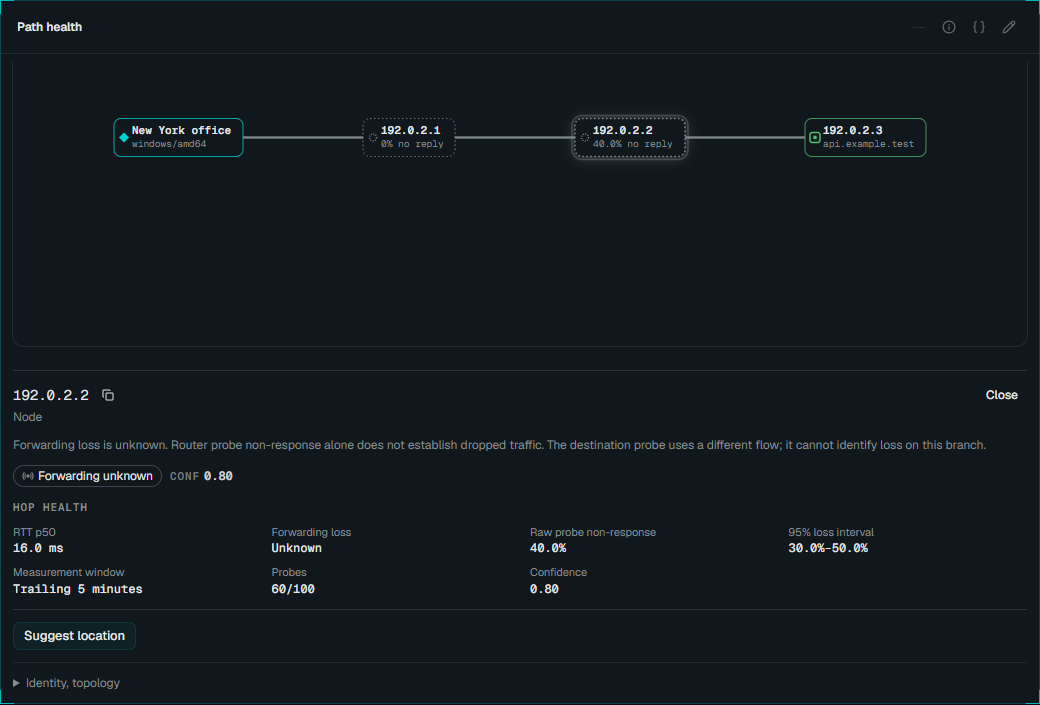
The path shows the observed hops between the agent and the target, with the latency, jitter and loss evidence available for each one. Missing responses do not establish a complete route.
Read it from the left, keeping forwarding loss separate from probe non-response. A router can forward traffic while limiting its replies to probes. Missing replies alone prove neither dropped traffic nor a healthy hop. Localizing loss needs eligible downstream evidence from the same flow and measurement window; a destination probe on a different flow cannot clear a branch or identify its loss onset.
Hops carry a confidence verdict. Forwarding unknown stays neutral when the evidence cannot establish forwarding health, even when the raw non-response percentage is high. See the trust model for the evidence behind these markings.
Selecting a hop shows its detail. Where a path fans out across multiple routes, the view shows the fan-out rather than collapsing it into an average of physically different paths.
 Enlarge screenshot
There is also a geographic view, which is the fastest way to see that your traffic to a service two miles away is transiting another continent.
The timeline
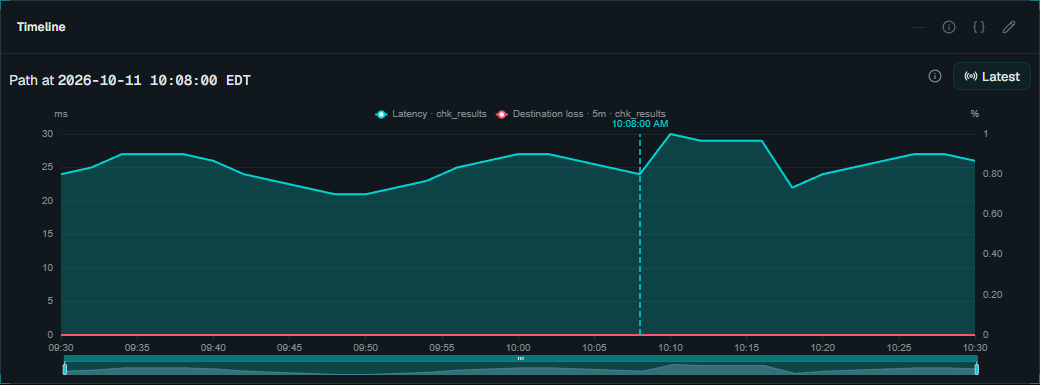
The timeline runs under the panels and is how you move through time.
Click a moment and the panels show the path as it was then. This turns “it was fine an hour ago” from an assertion into something you can check, and it is what makes the route fingerprint useful: you can see the path before the change and the path after it, side by side, rather than inferring a reroute from a step in a latency graph.
Latest clears the selected instant. Enable Live to keep following new data.
 Enlarge screenshot
Time range and live mode
The range control offers 15 minutes through 30 days. Dragging across any chart zooms to that span, and Reset zoom returns to the selected range.
Live keeps the view current as data arrives, which is what you want on a wall display or while watching a change take effect. Leave it off while investigating; a view that moves under you is difficult to reason about.
Copy the address bar to share the current investigation. Links retain filters, the time range, zoom, selected timeline point, saved view, mesh leg and panel tabs. Browser Back and Forward restore your selections. Custom ranges, zooms, selected points and paused Live views use fixed timestamps; a rolling preset such as Last hour stays relative when reopened. Selecting another preset or enabling Live clears the zoom and selected point.
Filtering results and dashboards
Choose Add filter to narrow the view by test, test group, check type, target, agent or cluster, network scope, status, operating system, version, or test and agent tags. Tags use the labels already configured on your tests and agents. A check inherits its test group’s tags and can override a value.
Select one or more values, then choose Add filter. Values within one filter match any; separate filters must all match. Use is not to exclude values, exists to require a tag, or is missing to find items without it. An empty tag value still counts as present.
Click a filter chip to edit it, use its × button to remove it, or choose Clear filters. The URL retains your selection for sharing and reloading. Filters follow current test and agent tags, including when viewing an older time range. They do not reconstruct tags at measurement time.
Metric and result panels follow the selection; pinned panels keep their own scope. Built-in account summaries identify themselves as account-wide when filters are active. Charts support up to 80 separate series; aggregate agent queries include all matching agents. Narrow the filters for larger individual agent breakdowns.
Inspecting one record
Any result panel offers Inspect, which opens the underlying record: the complete measurement as it was reported, including fields no panel shows.
This is worth knowing about because it is the end of the line for “but what did it actually say”. There is no level of detail below this one, and nothing is withheld from it.
Service and browser evidence
For service checks, inspect pass/fail, the failure reason and the phases actually attempted. A successful TCP connection does not prove authentication or an application assertion succeeded. Missing timings are not zero. Database values, credentials and service payloads are not retained in result telemetry; inspection cannot recover data the collector never stored.
Throughput describes goodput under the configured byte/rate budget, not maximum circuit capacity. RTP reports each direction separately; SIP describes signaling. Preserve agent, resolved destination and time window when comparing them with network diagnostics.
User Browser Sessions results follow sessions, then an ordered page list, then the selected page’s timings and resource waterfall. Synthetic Browser captures are a separate check. For incident-triggered application excerpts, open Log evidence on the incident.
Saved views
Having arranged panels the way an investigation needs, save it as a named view on the test.
Views are per test and appear in a dropdown on the Results tab. The pattern worth adopting is one view per recurring question (a “certificates and DNS” view, a “path only” view) so that the next time the same question arrives you start from the layout that answers it rather than rebuilding it under pressure.
Panels in a view are edited exactly like dashboard panels. See dashboards and panels.
Next
- Dashboards: metrics from several tests on one screen
- The trust model: what the confidence markings mean