Documentation menu
Creating a test
The test wizard end to end, choosing checks, setting a target, assigning agents, and scheduling.
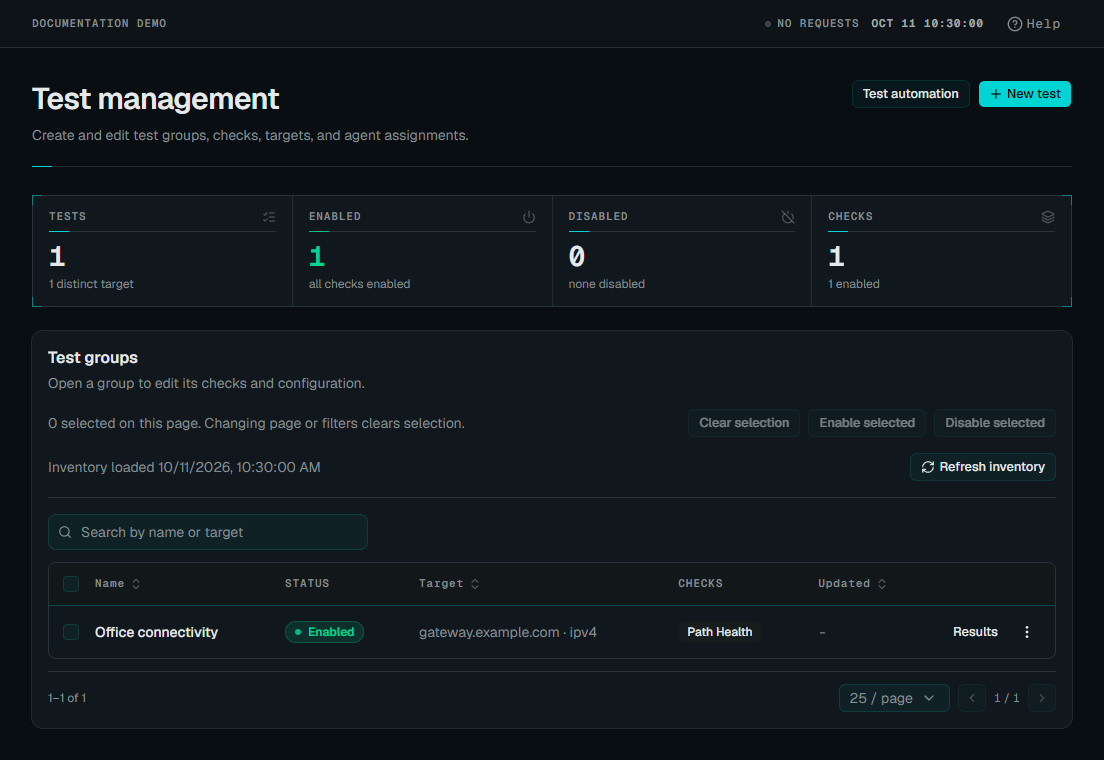
A test groups checks about one monitoring subject and their placement. You create one from Configure → Test management → New test.
 Enlarge screenshot
Before you begin
Have a target you are allowed to monitor and an enrolled agent, or an agent selector, ready. A local host check does not need a remote target.
The wizard keeps the step navigation, panel heading and Continue / Create test actions visible. Only the configuration body scrolls. On mobile, use the step selector to return to an earlier step. Moving between steps keeps the draft; leaving the wizard does not save it.
Step 1: what to measure
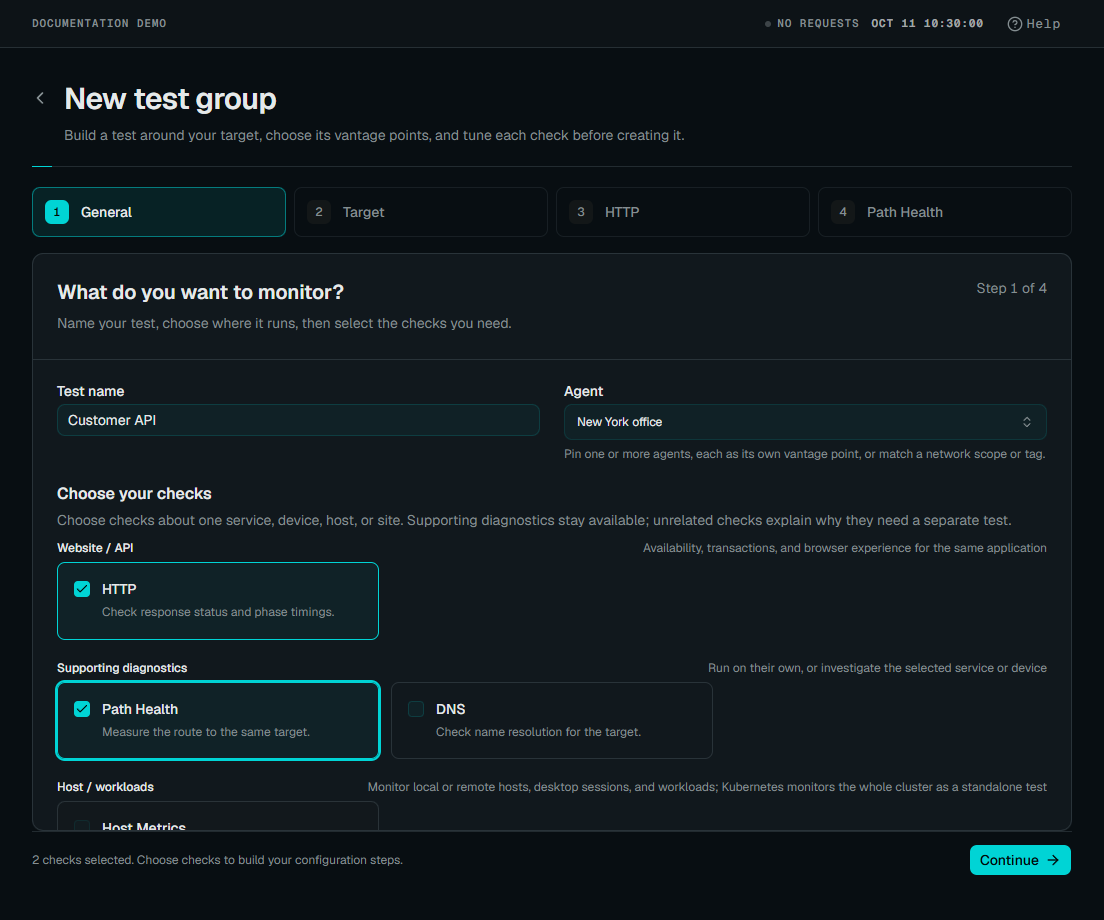
Name the test after the thing you care about rather than the mechanism. “Path to Frankfurt VPN” survives a change of check types; “ICMP trace 10.4.2.1” does not, and stops meaning anything the moment the address changes.
Then select the check types. You can pick several, and this is the point of the wizard: one definition, one target, several kinds of measurement, results together on one screen. A test against your public API might combine HTTP, DNS and Path Health so that when it goes slow you can tell within seconds whether the problem is name resolution, the network in between, or the application.
Incompatible selections grey out as you go. Each selected pair must concern a compatible subject (see check types) and the portal disables rather than hides them so you can see why a combination is unavailable.
Checkpoint: your test has a name, a placement and at least one check. Optional labels are in the expandable Labels section. Continue becomes available when the required settings are valid.
 Enlarge screenshot
Step 2: the target
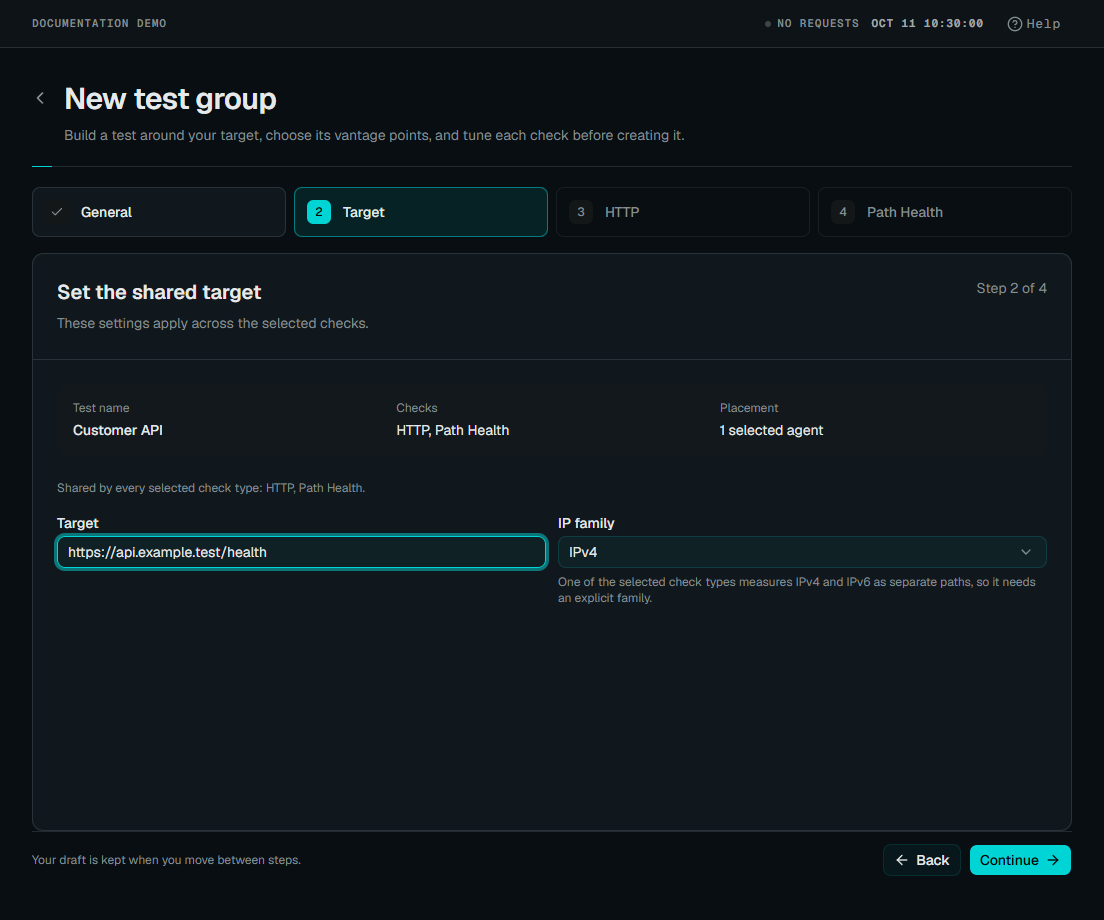
Most checks need something to measure against. What counts as a target depends on the check:
| Check | Target looks like |
|---|---|
| Path Health, TCP Connect, PMTU | A hostname or IP |
| HTTP, API Flow, Browser | A URL |
| DNS | The name to resolve |
| SSH, Remote Host Metrics, NTP, SNMP | A host, optionally with a port |
Local-link checks (DHCP, ARP Scan, LLDP Listen, WiFi Scan, Bluetooth LE Scan, eBPF Flow, eBPF Host, Containers and Host Metrics) have no remote target field, because they measure the network the agent is attached to, or the host itself, rather than something across it.
Database, SIP, gRPC, email, LDAP, RADIUS, MQTT and file services use a host/IP
with an optional port. WebSocket uses a ws:// or wss:// URL; Throughput and
RTP use the RouteSpear responder’s control URL. Kubernetes configures a cluster
collector, while User Browser Sessions use domain patterns. See
service checks and User Browser Sessions.
Address family
Auto, IPv4 or IPv6.
Pin it when the answer matters. A dual-stack host resolving to both will pick one, and if you are investigating a problem that only affects IPv6, a test that silently measured IPv4 has told you nothing while looking healthy. Some checks require an explicit family and will not offer Auto.
 Enlarge screenshot
Step 3: configure each check
The wizard shows one step per check type you selected.
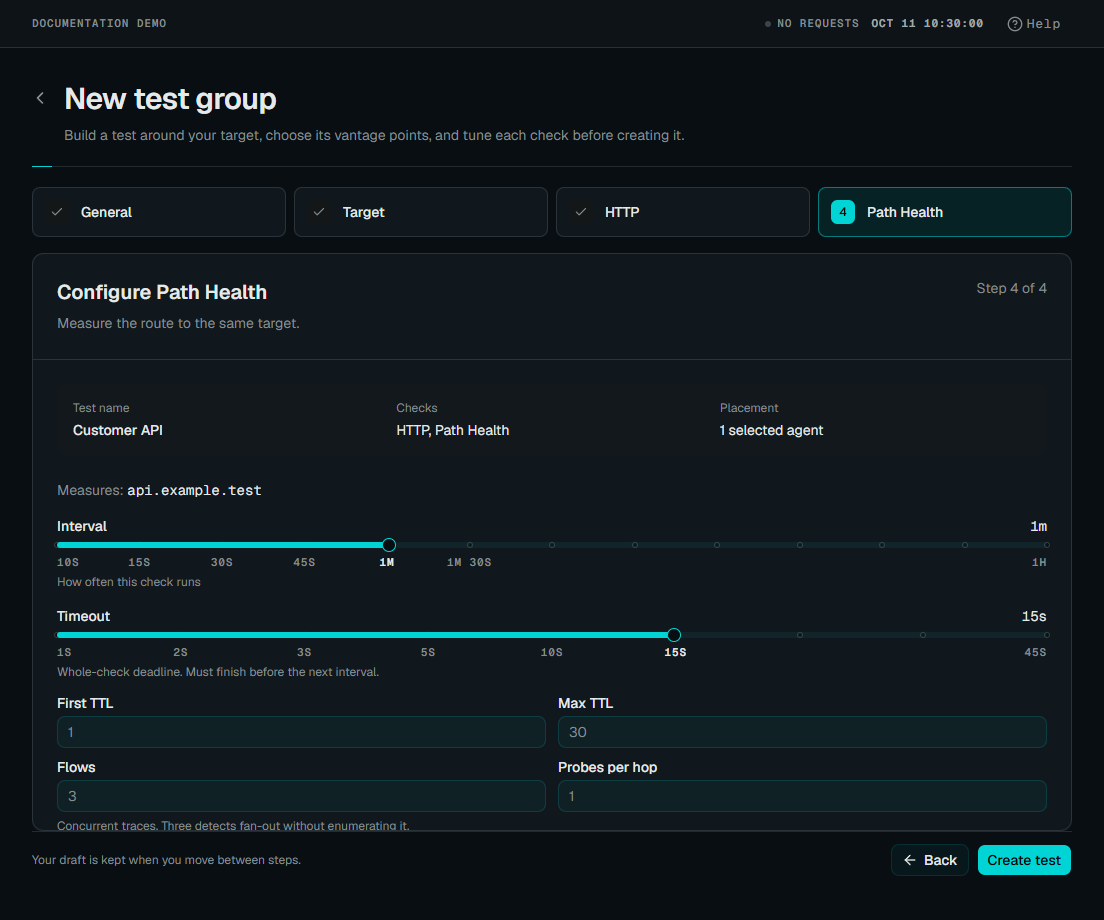
Interval is how often the check runs, in seconds. The defaults differ by type and are reasonable starting points. The consideration is that intervals buy resolution: a check running every five minutes cannot show you a ninety-second outage, and the shortest useful interval is the one that matches how long the problems you care about last.
Timeout is how long one execution may take, and must be shorter than the interval. Some checks cap it (NTP at 15 seconds, WiFi Scan and DHCP at 30) because beyond that the operation has failed in a way that waiting longer will not fix.
Everything else on the step is specific to the check type, and check types documents each one.
To limit collection to particular hours, assign checks to matching agents, or run them while an alert or metric condition is met, apply a test policy after creating the group. Running hours and each check’s interval are separate controls.
Event sources such as User Browser Sessions do not generate observations on a polling schedule. Credential references require a configured secret provider; a shared secret also needs an approved check/agent grant. Follow Secrets before expecting authenticated checks to run.
Checkpoint: the summary identifies the test, selected checks and placement. On the last check step, Create test saves the definition and opens its results. Earlier steps only advance the draft.
 Enlarge screenshot
Assigning agents
Remote Host Metrics requires exactly one specific source agent with SSH access to the target. It does not offer multiple agents or selector pools. Choose it under Host / workloads and use its password or private-key secret picker. The server fingerprint is required for either login method. See the remote host setup guide.
For other checks, the first step lets you pick one or more specific agents, or a network scope or tag selector that stays in sync as the fleet changes.
Choosing a specific agent is what you want most of the time, because a measurement’s vantage point is part of its meaning. “The API is slow” is a different fact from Dublin than from the data centre, and averaging the two produces a number describing nowhere. Pinning several agents is how you measure the same target from several places under one test. Each is its own vantage, not an average.
A network scope or tag match is the alternative when membership should follow the fleet rather than a named box: one member of the matching pool runs the check, and that can fail over as agents come and go.
Local-link checks (Host Metrics, DHCP, ARP, WiFi, and the rest) measure the agent host itself, or the network it sits on. A different agent is a different subject, not a different view of the same one, so these always need a pinned machine (or a selector that currently matches one).
Note that labels are not an agent selector. They group tests for dashboards and queries; they do not decide which agent runs what.
After it exists
Open Configure → Test management and select the test, or choose Configure test from its results.
You can rename it, change the target, change the address family, and edit labels. You can add checks, edit an existing check’s schedule and parameters, or delete a check. New checks are restricted to types compatible with what the test already contains.
Enable and disable turn a test off without deleting it, which is the right move during planned maintenance; you keep the definition and the history, and you do not spend a week wondering why the graph has a hole in it.
Deleting a test removes the definition. Records already collected age out on their normal retention schedule.
Next
- Check types: what each one measures and when to use it
- Scheduling & automation: running hours, assignment, and conditions
- Multi-agent mesh: measuring between your own sites
- Reading results