Documentation menu
Quickstart
Install your first agent from the portal and get a path measurement on screen in about ten minutes.
By the end of this page one host will be measuring a real path continuously and you will be looking at the results. You need a RouteSpear account and a machine you can install software on.
Your first successful measurement
Follow this path: enroll an agent → create a test → inspect a result. Keep the portal open beside this guide.
- After installation, the agent should appear in Configure → Agents. If it does not, use agent troubleshooting.
- In Configure → Test management → New test, select the agent and a check. The wizard keeps its actions visible while the fields scroll.
- After creation, wait for the configured interval and delivery, then inspect the test’s results. An empty chart is not evidence that a target is healthy.
The test creation guide explains placement, compatibility and per-check settings in detail.
1. Add an agent
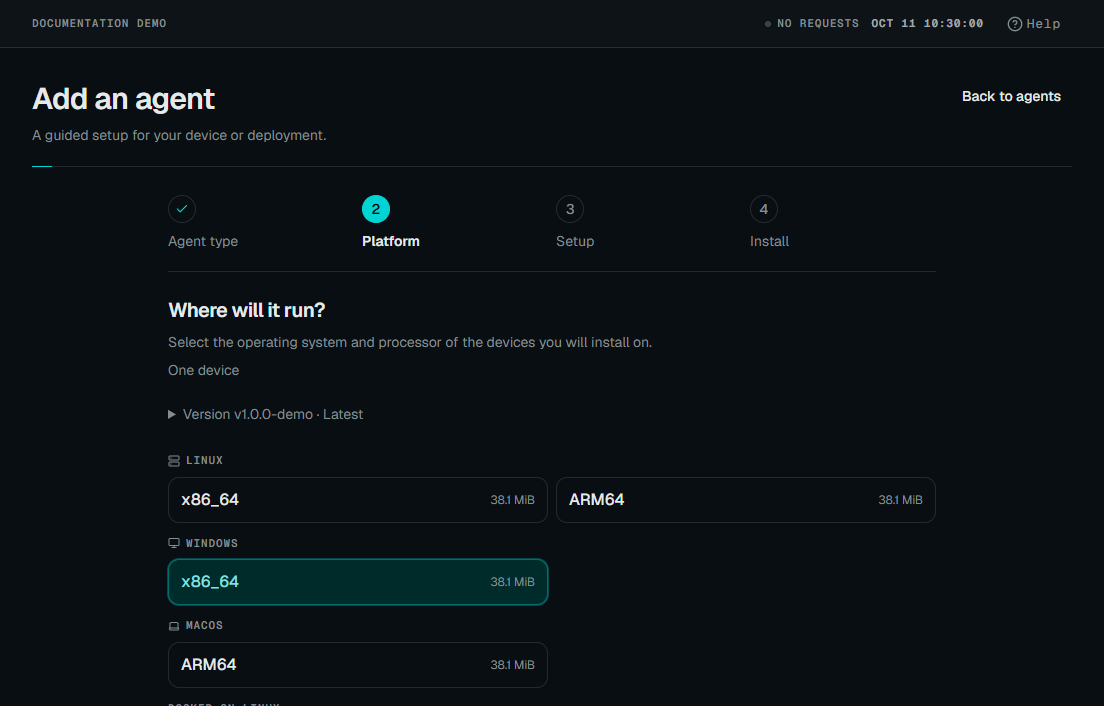
In the portal, go to Configure → Agents and choose Add an agent, then One device.
Pick the platform of the host you are installing on. RouteSpear builds for Linux (x86-64, ARM64 and ARMv7), Windows (x86-64 and ARM64) and macOS (Intel and Apple Silicon), so a Raspberry Pi in a branch office is as valid a vantage point as a server.
 Enlarge screenshot
Select Continue, review the setup, and download the install pack. This is not just the binary: it is an archive
containing the agent, the rsctl diagnostic tool, checksums, install scripts,
and an enrollment token for your organisation.
That token is single-use and valid for 24 hours. One pack installs one machine. Copying the folder to a second host does not work and is not meant to – mint a fresh pack per machine from the portal, which also means a pack that leaks stops being useful within a day.
2. Run the installer
Unpack the archive, keeping every file together, and run the installer. It needs administrator or root, because installing a system service does.
Linux
tar -xzf routespear-agent-*.tar.gz
cd routespear-agent-*
sudo ./install-service
macOS
tar -xzf routespear-agent-*.tar.gz
cd routespear-agent-*
sudo ./install-service
Windows
Unzip the archive, then double-click Install Service.cmd and accept the administrator prompt.
Expand-Archive -Path .\routespear-agent-*.zip -DestinationPath .\routespear-agent
Set-Location .\routespear-agent
& '.\Install Service.cmd'
Do not double-click routespear-agent.exe. It is the service binary rather
than an installer, and on its own it prints usage and exits.
On Linux this writes a systemd unit and enables it. On macOS it writes a
launchd daemon and bootstraps it. On Windows it copies the files to
%ProgramData%\RouteSpear\Agent, registers the RouteSpear Agent service,
and adds a firewall rule so ICMP replies come back.
On a Unix host with neither systemd nor launchd, the script stops and tells you
to run ./start-agent instead. It does not pretend to have installed something
it did not.
If you would rather not run a packaged script (because you deploy with configuration management, or into a container) everything the script does is available as flags. See the CLI reference.
3. Watch it appear
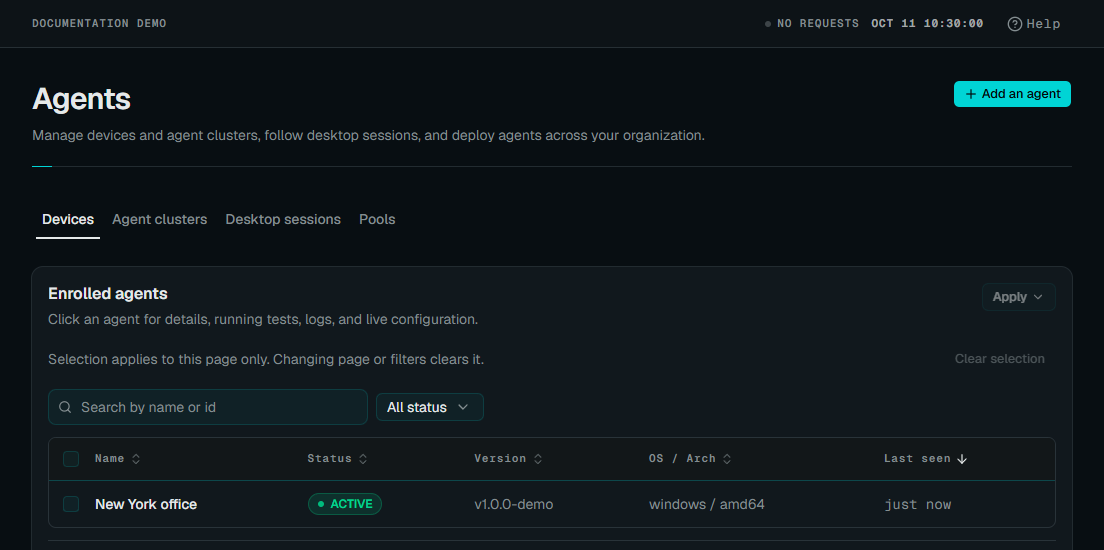
Leave the portal dialog open. It polls for the agent, and the agent registers itself the first time it tries to ship data. Within a minute or so it appears in the agent list with its version, operating system and a green status.
Nothing had to be typed into the portal to connect the two. The credential was already inside the pack.
If it does not appear, troubleshooting covers the handful of things that usually cause it.
 Enlarge screenshot
4. Create your first test
Go to Configure → Test management and choose New test.
For a first test, pick Path Health. It is the one that shows what RouteSpear is for: rather than telling you whether a destination is reachable, it measures every hop between your agent and that destination, continuously, and notices when the route itself changes.
Give it a name, choose the agent you just installed, and set a target. Something you genuinely care about is more interesting than a public resolver, your VPN concentrator, your ERP host, the SaaS application people complain about.
The wizard then shows a configuration step for Path Health. The defaults are sensible; you can leave them.
5. Read the results
Open the test. Results begin arriving within a couple of intervals.
The path view is the place to start. Each hop appears in order with its own loss, latency and jitter, so a problem has a location and not just a symptom. Hops that could not be measured reliably are marked as such rather than being drawn as though they were solid, a router that rate-limits ICMP produces alarming-looking loss that is not real loss, and RouteSpear says so instead of letting you page someone about it.
Use the timeline to move back through time. Selecting a moment shows the path as it was then, which is what makes “it was fine an hour ago” a checkable claim.
Reading results goes through the views in detail.
Next
- Core concepts: the handful of terms the rest of the docs use
- Check types: everything else you can measure
- Creating tests: targets, agent assignment and scheduling
- Dashboards: putting metrics from different tests on one screen
- Metrics Explorer: querying any metric directly, without building a panel first
- Alerts: writing a health rule so you hear about it instead of finding it here